One of the more important issues on the minds of C-level management is data transparency. Managers need to have an overview of the product or service sold, the operation, the sales & marketing, and – the employees. Being able to monitor the performance in real-time, not only allows for healthier management, now, but also improves the decision-making process for years to come.
Employee group shuttle and transportation is a service adopted by an increasing number of organizations. It is no longer just a ‘nice to have’ benefit, or one supplied by remote factories, but a ‘must have’ cross-industry and location addition. With gas prices on the rise, along with traffic and harmful emissions, people need transportation alternatives.
But, with the service supplied comes a new need – data transparency. About the cost involved, the vehicles, the routes, the employee usability and operational optimization.
But, how is that possible – transforming the raw data into something human-readable?
OptiCity – Seeing is believing
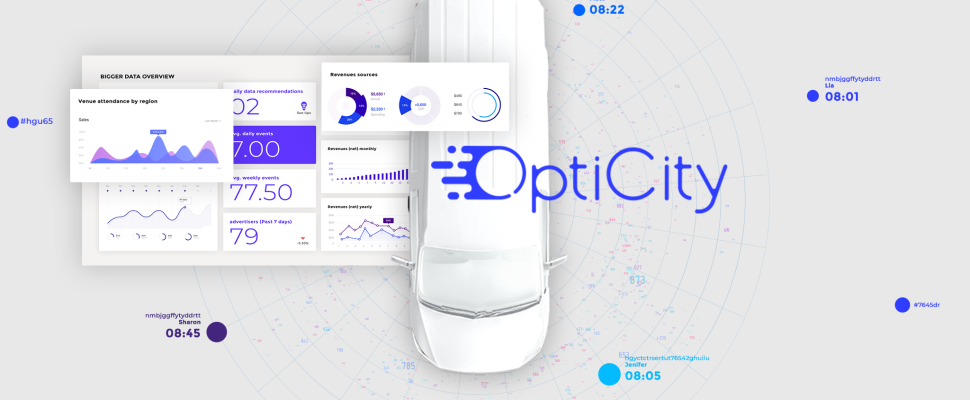
The standard tool for performance insights and data accessibility, is a dashboard. It provides a quick visual display of all your data, on the front page of the software.
The dashboard is tailored to suit the customer’s unique KPIs. These may differ between industries, locations, markets, countries, and so on. Even in similarly based industries, like high-tech/software providers, the company policy may differ and impact the Key Performance Indicators (KPI).
One organization may look to save costs, another to get their employees to work quicker, and another to lower the number of vehicles used.
Our customers enjoy:
• Timesaving – Eliminate the need to collect data from different sources, departments, and systems. Using one dashboard hub save hours of manual work, along with great resources and human errors that come with it.
• Visibility – real-time analytics of the entire transportation service including overall costs, per employee, per vehicle, per time period and much more.
When a change or an alteration happens (within a schedule, cost, route, employee usability), view the immediate impact on the business.
• Predictions – full process understanding enables managers to make better decisions and anticipate future occurrences.
Establish targets, set goals, and understand what and why something happened.
Succeed using the data
Intuitive to any user – the OptiCity interactive dashboard graphic design allows easy and smooth navigation throughout the information. It is also accessible by any mobile device, in any location.
You no longer need to dig into extensive reports, excel spreadsheets, or listen to opinions…the insights are right in front of you!
CEOs, Purchasing, or Human Resource manager – we welcome you to contact us and find out more about optimized transportation solution. The kind that not only enables superior service, and saves costs, but also provides complete transparency.


